ML interpretation deals cause and effect within the model. It describes what occurs during training or prediction.
- Exploratory data analysis checks dataset examples, counts, distributions (means and standard deviations), histograms, and correlations.
- Weight analysis finds representative data points, for example by finding items closest to a cluster or embedding or items that maximize probabilities of a class, that is associated with each parameter.
Explainability digs deeper, translating the system into human terms. In other words, it explains the reasons why the model acts in a certain way. Understanding this reasoning is crucial for debugging, science, and decision-making. One core method is measuring feature importance.
Feature Importance
There are three core methods to measuring in importance of each feature.
Univariate Correlation
Univariate correlation builds a model on a single feature to measure how well it correlates with the label. We can also measure Pearson correlation (linear) or Spearman correlation (curve) for the feature and label; however, extremely non-linear relations would not be reflected in these two statistical methods even though it’s perfectly possible to fit a model on the relation.
Feature Removal
Feature removal evaluates the effect of “removing” a feature by replacing it with its average or permuting across samples. In this process, interventional methods may break invariances whereas conditional methods change other features as well to respect correlations (BMI and weight, for example). We can also literally remove it from the data and examine the change in performance.
Note
Note that features removed during feature selection or those removed here may be redundant but still correlate with the label; in other words, model interpretation does not directly translate to problem interpretation!
Partial dependence plot reverses the average removal idea, marginalizing all features except one to find its effect on the label. This is similar in effect to univariate correlation.
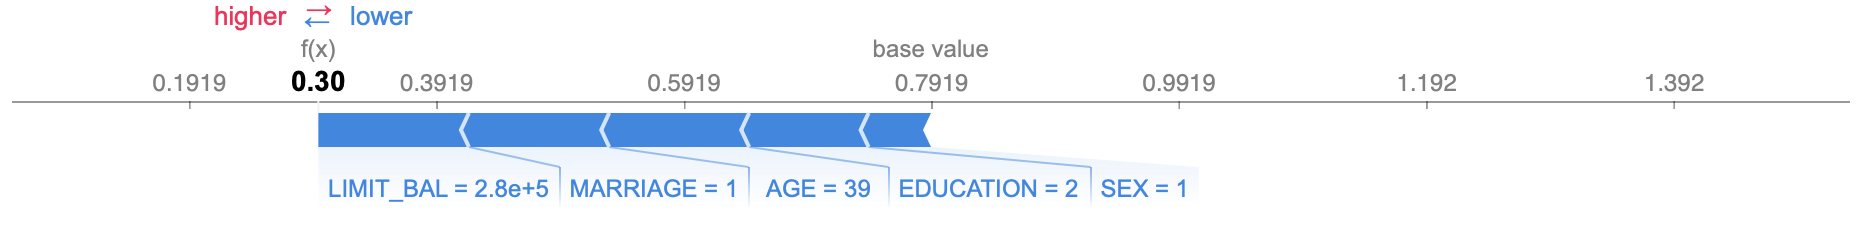
Shapely Values
Shapely values mathematically correlate features with their effect on labels. Intuitively, it measures the marginal contribution of each feature on the prediction.
Below is an illustration of the combined effects of features on a prediction probability.
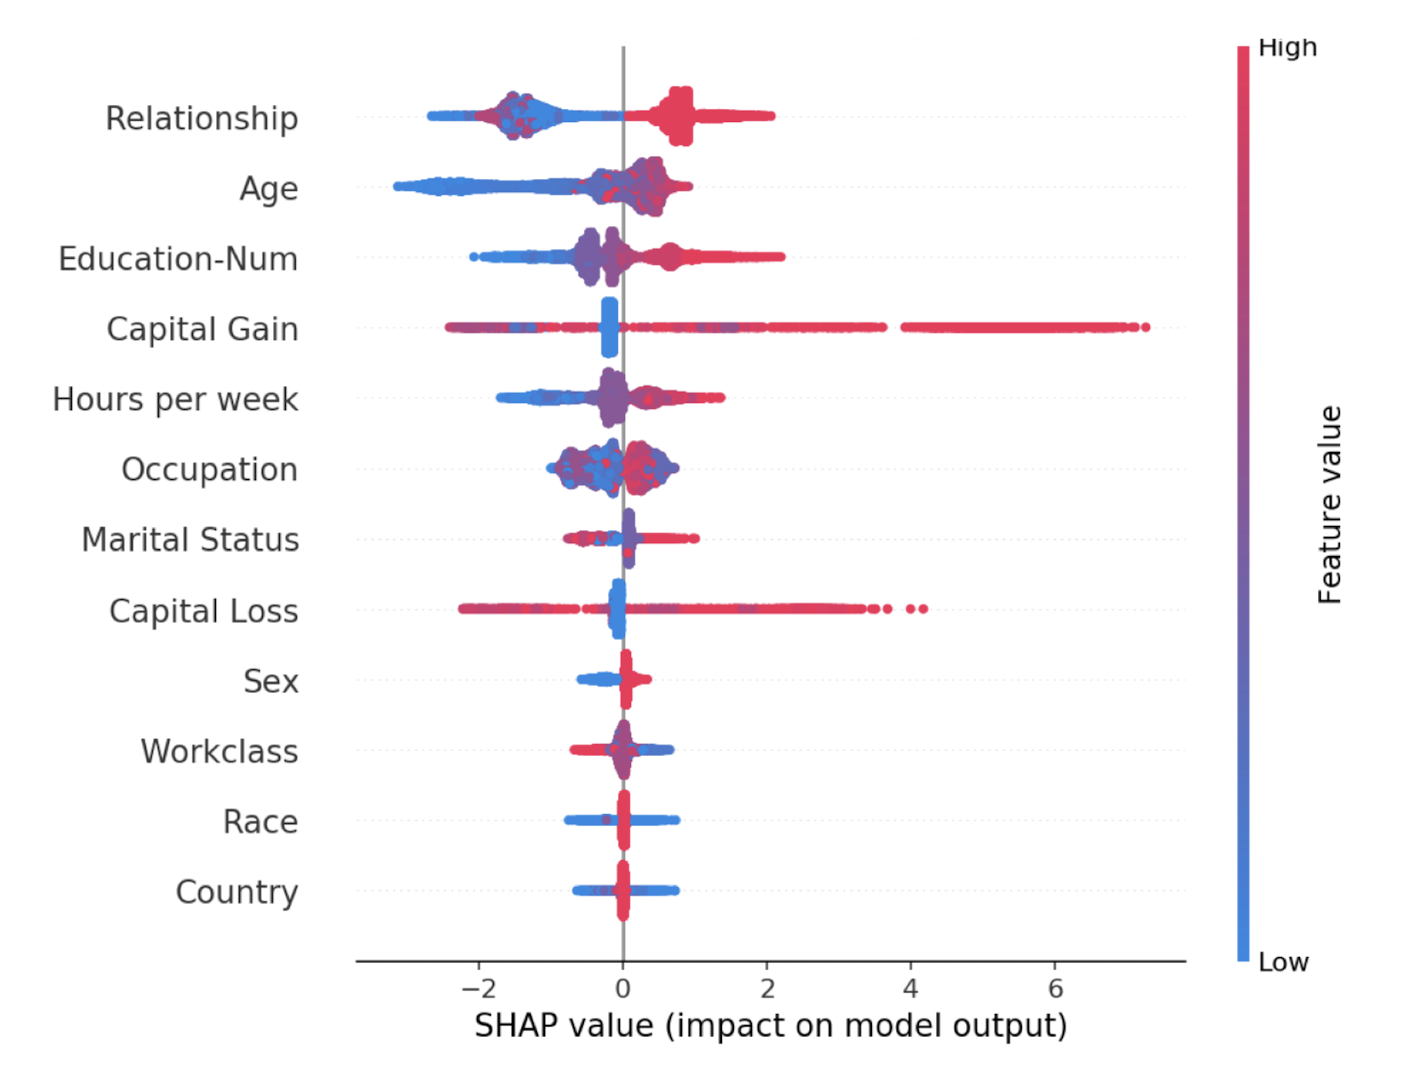
We can also plot the correlation of SHAP values and features values.
Or examine one feature more closely.

Causality
Finally, note that correlation doesn’t mean causality. The main causal algorithms in machine learning are reinforcement learning methods; supervised and unsupervised learning find correlations.