When building hardware, performance is incredibly important. The goal is to minimize latency and maximize throughput:
- Latency: time to finish fixed task (execution time).
- Throughput: how many tasks it can finish per unit time.
We can decompose latency as
The number of instructions per program is obviously up to the user, but a hardware designer can improve the cycles per instruction—called CPI—and seconds per cycle—the clock period. Clock period can be improved with faster transistors and micro-architectural techniques such as multi-cycle or pipelined processors; however, note that these techniques will increase CPI, though it’s a favorable tradeoff.
When measuring performance, it’s important to be wary of two kinds of errors:
- Systematic error: some bias in the system, like unexpected external load.
- Random error: randomness in the system, need to run many times.
Benchmarks
Performance testing of a chip must be done with some standardized workload—a benchmark. There are benchmarks that test the entire chip, being representative of actual programs people use, and also micro-benchmarks that isolate certain parts of performance. Examples include SPECmark 2017, GeekBench, and GTA V.
Performance Laws
There are some mathematical laws that describe how certain performance metrics are related to each other.
Amdahl’s Law
Amdahl’s law describes the total improvement of a system given an optimization,
where
This law is especially relevant for parallelization, where we instead have
where
- Strong scaling: shrink the serial component.
- Weak scaling: increase the problem size, thereby naturally requiring more parallel work.
Little’s Law
Little’s law models three metrics of a queueing system: the number of items
This law assumes that the system is in steady state—the average arrival rate is the average departure rate (throughput). This is useful for a variety of queues, from caches to network requests.
Latency-Throughput Relation
For latency
assuming that tasks follow a M/M/1 queue:
- Task arrival is Markovian (independent of previous tasks).
- Service time is Markovian.
- We service 1 task at a time.
- Arrival rate is unaffected by queue size.
This relation describes the tradeoff between latency and throughput—it’s difficult to optimize both.
Roofline Model
The two common bottlenecks are compute and memory bandwidth, and it’s important to figure out which is the one limiting the system so we have a good target for optimization.
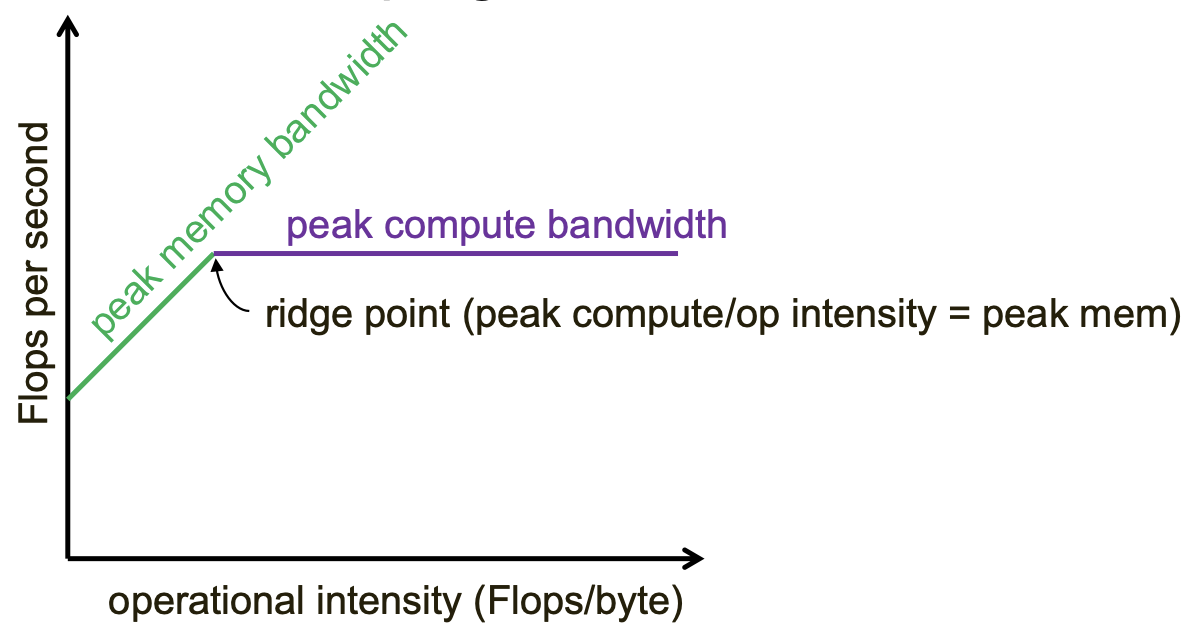
To do so, we compute operational intensity, which is the amount of compute on each byte brought from memory (Flops/byte). Then, plotting out operational intensity versus Flops/second, we have a “roofline” graph:
- At low operational intensity, Flops/second increases linearly, indicating that the limitation is caused by memory.
- At high operational intensity, Flops/second is flat, indicating that the limitation is caused by compute.
