COMPAS is a criminal recidivism predictor that outputs 43 risk and needs scores from a 137-question survey. Many questions are about people around the defendant, and notably, the survey asks about arrests rather than convictions—introducing the police department’s bias into the answer.
ProPublica Analysis
ProPublica analyzed a specific COMPAS score, ranked from 1 through 10, on a past Broward county dataset, comparing its predictions with ground truth recidivism. Their core findings are as follows:
- The distribution of risk over decile scores was different between white and black populations. This alone doesn’t imply bias since the ground truth distribution might be different, but we can verify it by interpreting the scores as probabilities of recidivism and comparing with the ground truth (calibration).
- Applying a cutoff binary prediction (high or low score), PP built a logistic classifier that predicts high/low from personal attributes and found that race was a strong predictive factor.
- Using the same threshold, the confusion matrix containing error rates like true positive rate (TPR) and false positive rate (FPR) also showed disparities across races. Specifically, PP found that black FPR was significantly higher than white FPR, implying that black criminals were more often incorrectly assessed as high-risk.
Northpointe Rebuttal
Northpointe argued that the ROC curve (x axis is FPR, y axis is TPR) formed by varying the threshold
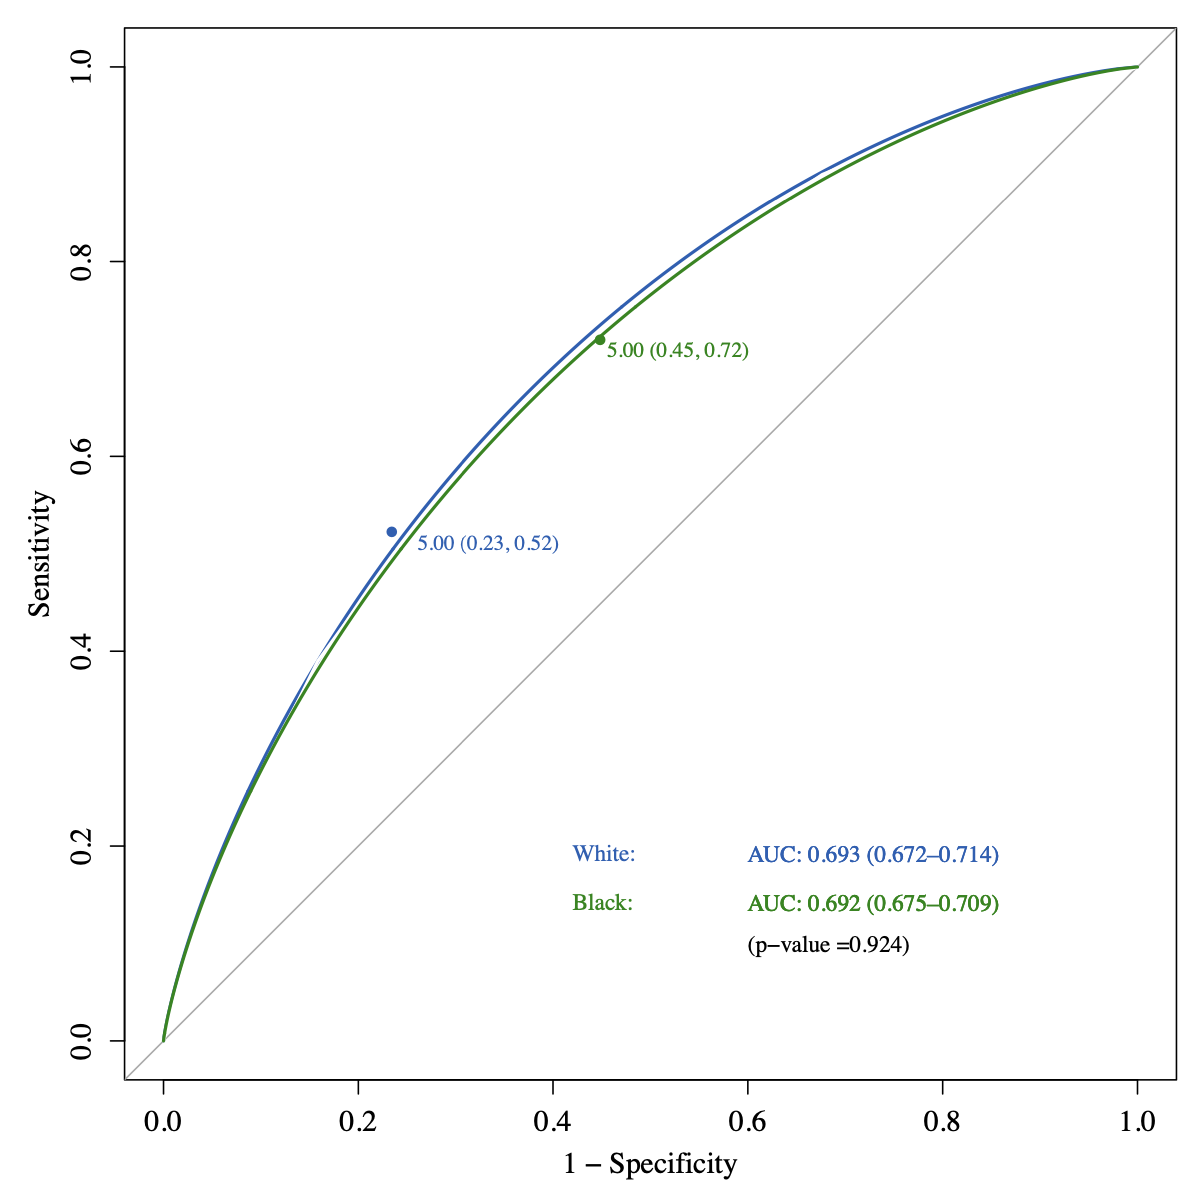
For example, the threshold values
Definitions of Fairness
Ultimately, PP argues that COMPAS is unfair since the false positive rates are significantly different across races while using the same threshold, and Northpointe defends by claiming that COMPAS is fair since the AUC of the ROC curves are equal. Unfortunately, both definitions of fairness are valid, and thus both arguments are valid—who’s right is ultimately up to personal interpretations.